
Talking about the Iran war in macro class yesterday, a student asked if the oil price increase seen to date constituted an “oil shock”. I answered, in terms of price increase so far, not yet, and terms of level, oil prices are still fairly low. However, it then occurred to me that there is a intermediate measure, due to Jim Hamilton. First, WTI oil prices:
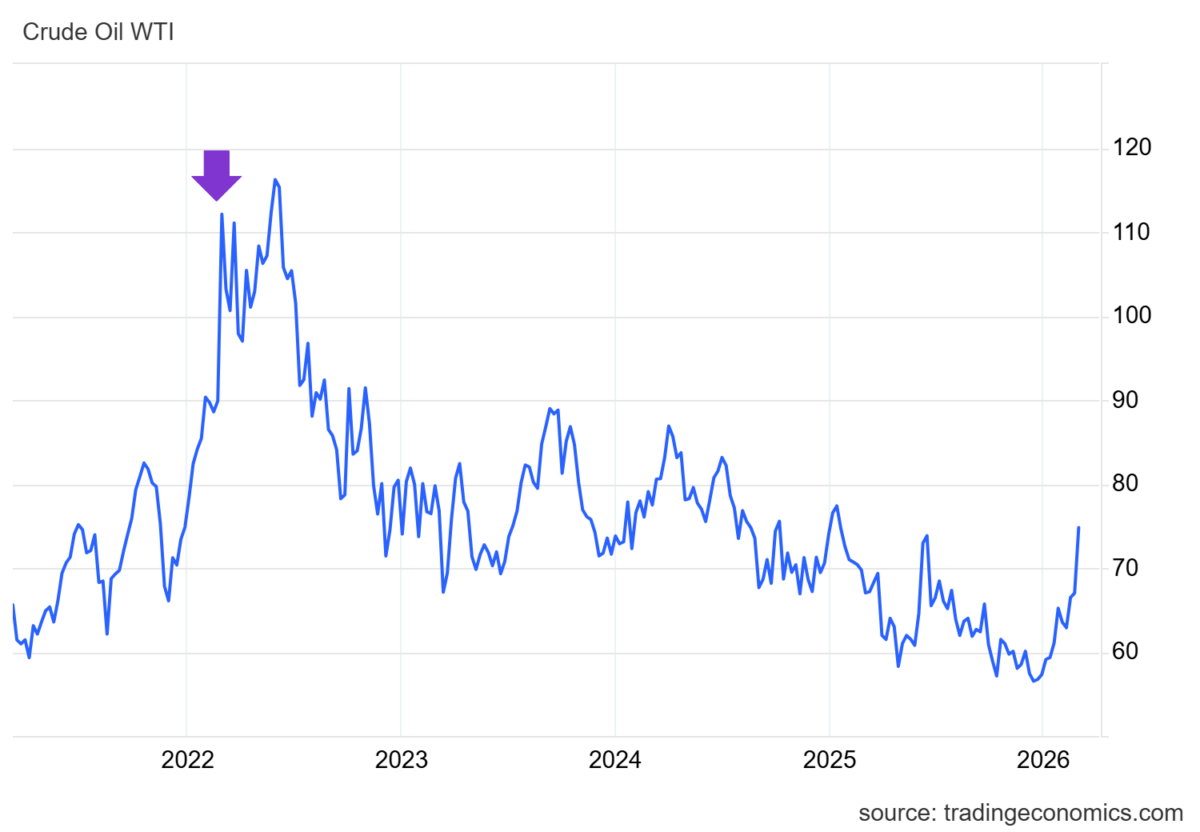
Figure 1: WTI oil price, $/bbl. (blue). Purple arrow at Russian invasion of Ukraine.
Clearly, there’s been a sharp increase in a short period of time. One natural question is whether the change or the level of oil prices enter into determining inflation (and output). Hamilton (JPE, 1983) suggests a Net Oil Price (NOP) variable, which is the price relative to the maximum over the previous year (or three years), and taking on a value of zero if the price is less than the local maximum. This reduces the importance of large upward movements that offset previous declines.
Leblanc and Chinn (Bus. Econ., 2004) find that this NOP does as well a specification including lagged price changes and and allowing for asymmetry due to increases and decreases in oil prices. Quick regressions over the 2000-2026 period indicate that a specification with two lags of oil price changes and a specification with NOP have have essentially the same explanatory power for PCE deflator inflation y/y.
Here’s the NOP variable, assuming price of $75 holds for all of March, and if the price of $100 holds for all month (when February WTI was at about $64).
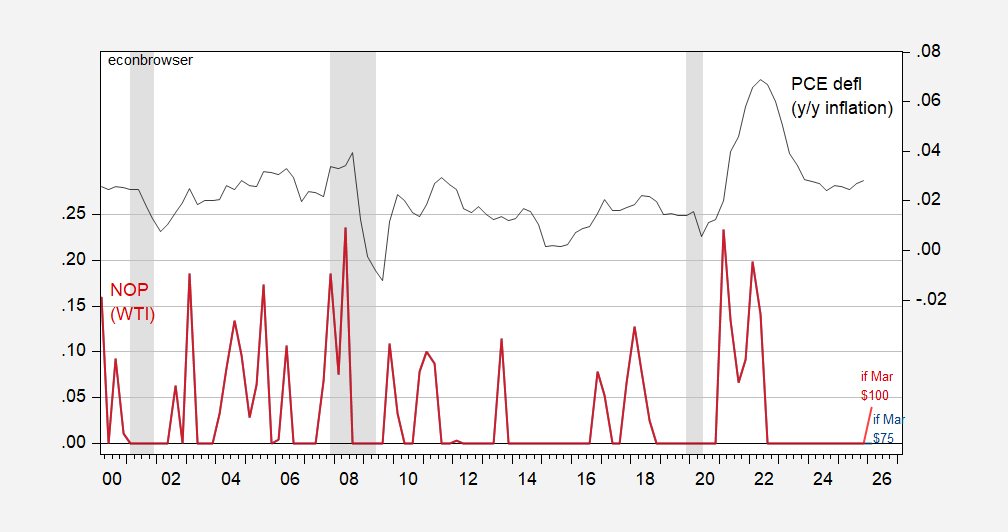
Figure 2: Hamilton Net Oil Price (NOP) for WTI, if March price at $75/bbl (blue, left scale), at $100/bbl (red, left scale), PCE y/y inflation (black, right scale). NBER defined peak to trough recession dates shaded gray. Source: EIA via FRED, BEA, and author’s calculations.
Note that NOP in Q1 is zero assuming WTI at $75 in March; it’s 0.04 for WTI at $100. A regression of PCE y/y inflation on lagged NOP yields a coefficient of 0.11. Hence, were WTI to rise to $100 in March, then y/y PCE inflation would rise by 0.4 percentage points in Q2.