
Using NYMEX futures for May, June:

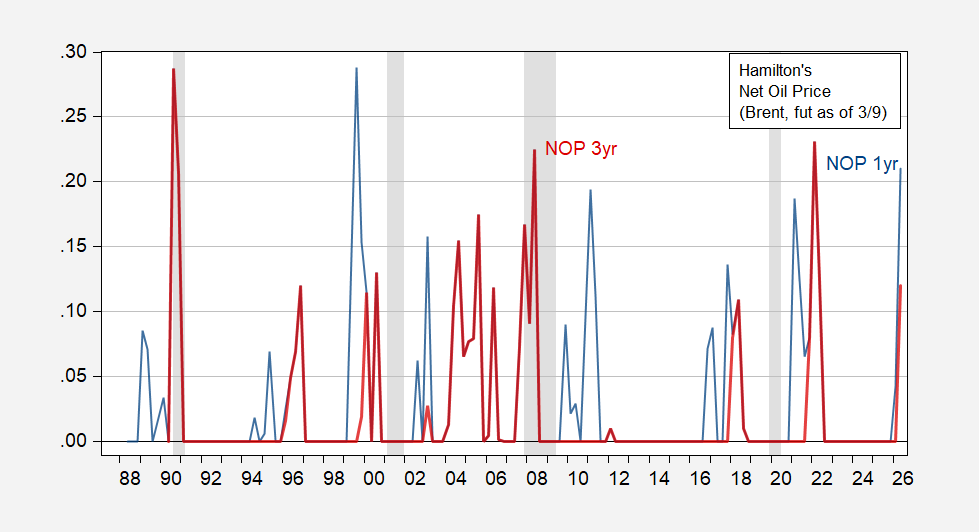
Figure 1: Net Oil Price (Brent), defined relative to previous year (blue), defined relative to previous 3 years (red). NBER defined peak-to-trough recession dates shaded gray. Source: EIA via FRED, NYMEX via barchart.com, NBER, and author’s calculations.
The one year measure is due to Hamilton (JPE, 1983) and the three year to Hamilton (J.Econometrics, 2003). Jim’s recent review of oil prices and macroeconomy in the New Palgrave of Economics here.
The NOP calculations go through Q2; I use futures as of today of about $94/bbl (Brent) for June, $100 before. NYMEX futures as of 2pm CT indicate about $77 by December settlement, so the market anticipates a resolution of some sort that opens up the Strait of Hormuz by then.
The association between recession and NOP is unclear, or not as clear as the pre-2010 period. As for inflation, the correlation between NOP and PCE deflator inflation is more obvious.