

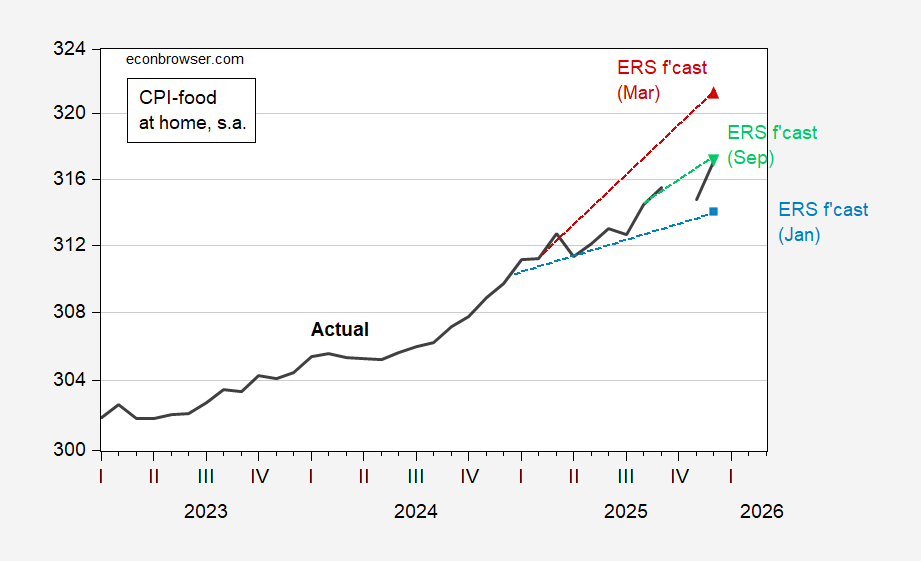
Reported hits the September USDA Economic Research Service forecast. Figure 1 displays the food-at-home component of the CPI, along with ERS forecasts:

Figure 1: CPI-food at home (bold black), January 2025 forecats (light blue square), March forecast (red triangle), and September (inverted light green triangle), all s.a. Source: BLS via FRED, ERS, and author’s calculations.
September 2025 was the last ERS forecast, given the government shutdown and lapse in data collection. USDA indicates forecasts will resume publication on 1/22/2026.
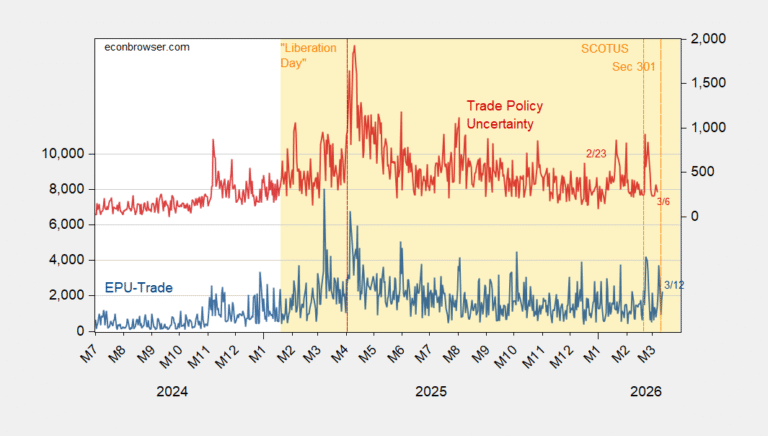
Grocery prices rose 2.4% y/y through December 2025. They rose 1.7% y/y through December 2024. So much for bringing down grocery prices.
I add one more graph of a component of food of particular interest to me: coffee!
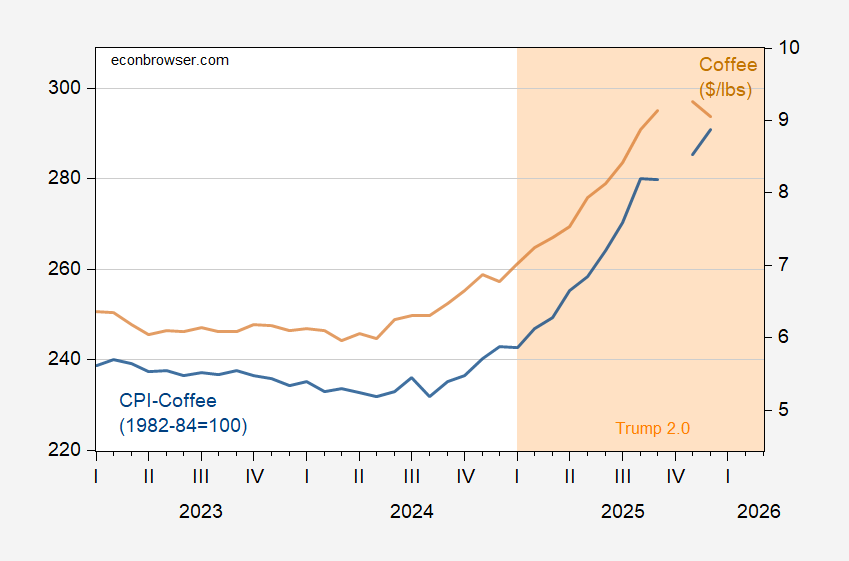
Figure 2: CPI – coffee (blue, left log scale), and coffee price per pound in $ (tan, right log scale), both s.a. Source: BLS via FRED.