


With the December release, we have the following picture of key indicators followed by the NBER Business Cycle Dating Committee:
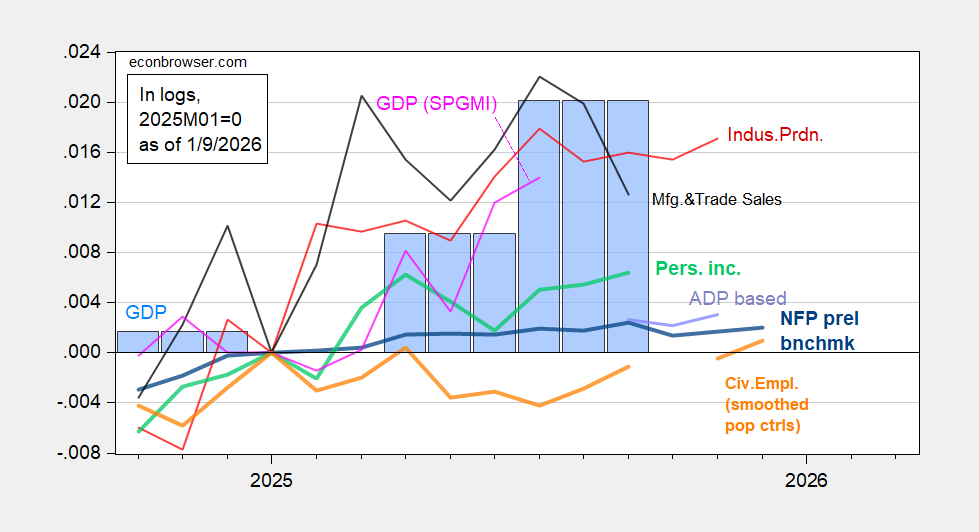
Figure 1: Implied NFP preliminary benchmark revision (bold blue), ADP based author’s estimate of November NFP (light blue), civilian employment with smoothed population controls (bold orange), industrial production (red), personal income excluding current transfers in Ch.2017$ (bold light green), manufacturing and trade sales in Ch.2017$ (black), and monthly GDP in Ch.2017$ (pink),GDP (blue bars), GDP (blue bar), all log normalized to 2025M01=0. Source: BLS, ADP, via FRED, Federal Reserve, BEA 2025Q3 initial release,S&P Global Market Insights (nee Macroeconomic Advisers, IHS Markit) (9/2/2025 release), and author’s calculations.