
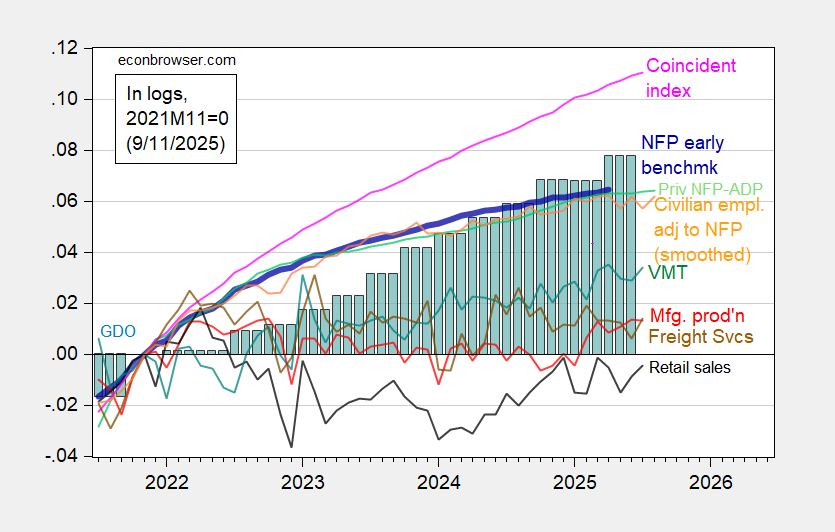
Freight transportation services, vehicle miles traveled, civilian employment adjusted to NFP concept all below recent peaks. Heavy truck sales down 17% y/y.

Figure 1: Implied Nonfarm Payroll early benchmark (NFP) (bold blue), civilian employment adjusted smoothed population controls (bold orange), manufacturing production (red), personal income excluding current transfers in Ch.2017$ (bold green), real retail sales (black), vehicle miles traveled (tan), and coincident index in Ch.2017$ (pink), GDO (blue bars), all log normalized to 2021M11=0. Source: Philadelphia Fed [1], Philadelphia Fed [2], Federal Reserve via FRED, BEA 2025Q2 second release, and author’s calculations.
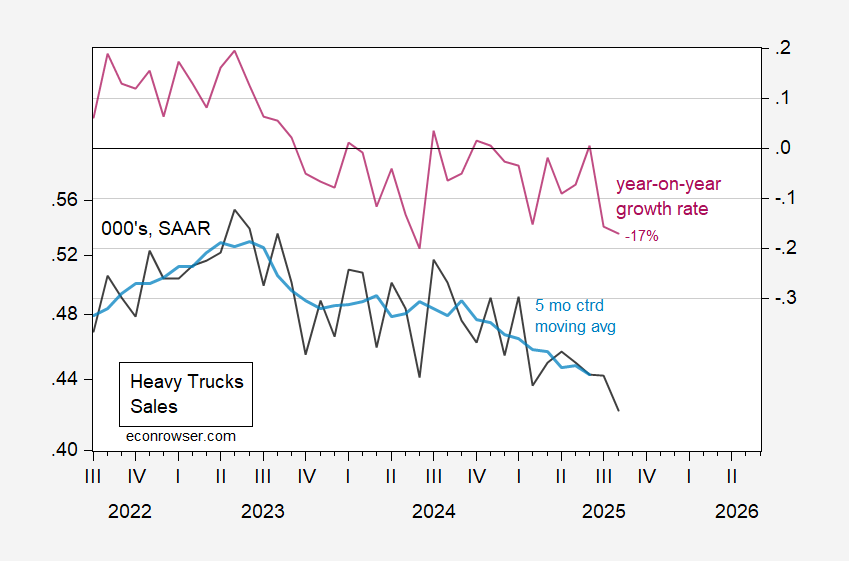
Figure 2: Heavy truck sales (black, left log scale), and 5 month centered moving average (light blue, left log scale), both 000’s, SAAR, year on year growth rate (burgundy, right scale). Source: Census via FRED, author’s calculations.
While heavy truck sales are down relative to recent peak, they aren’t yet at rates associated with recessions.