

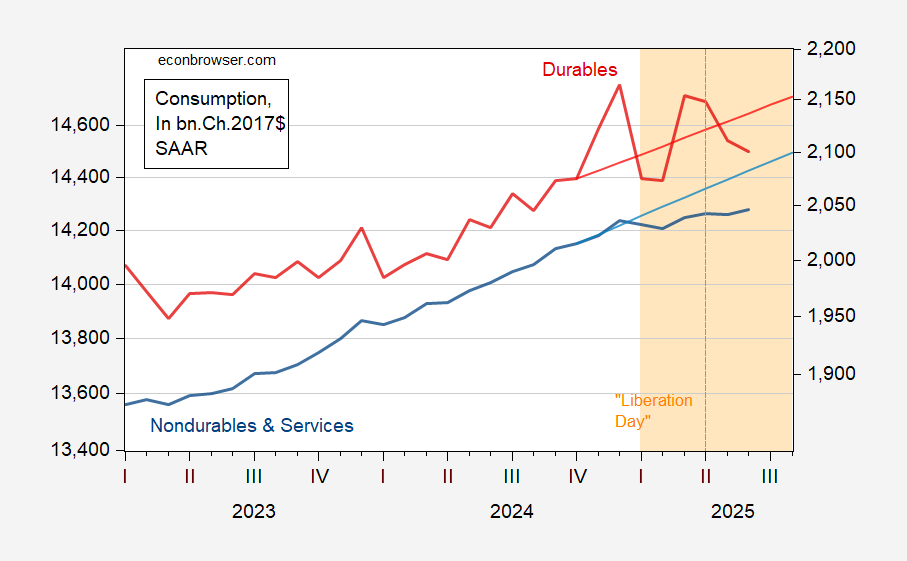
Durables consumption has experienced extreme volatility over the last 9 months (since the election). However, services and nondurables should follow the permanent income hypothesis — at least halfway (DSGE’s usually incorporate about 50% hand-to-mouth consumers). So what do we see?

Figure 1: Sum of nondurables and services consumption (blue, left log scale), 2023M11-2024M10 stochastic trend (light blue line, left scale),durables consumption (red, right log scale), 2023M11-2024M10 stochastic trend (light red, right scale), all in bn.Ch.2017$ SAAR. Orange shading denotes Trump 2.0 administration; orange dashed line at 2025M04. Source: BEA, July release, and author’s calculations.