


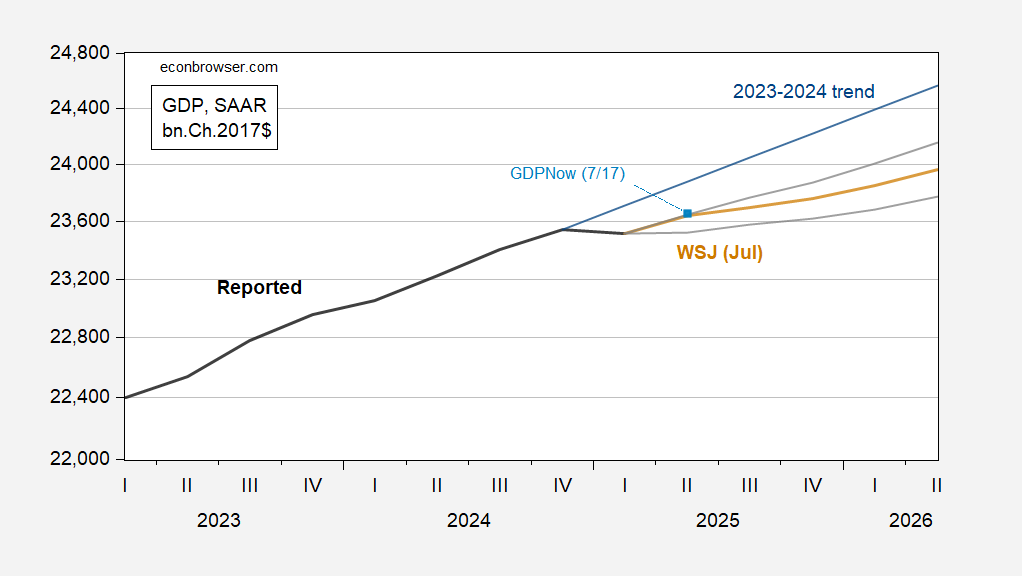
WSJ mean survey forecast relative to 2023-2024 trend.

Figure 1: GDP (bold black), 2023-2024 stochastic trend (blue), WSJ July mean (tan), WSJ 20% high/low band (gray lines), GDPNow of 7/17 (light blue square), all in bn.Ch.2017$ SAAR. Source: BEA, WSJ, Atlanta Fed, and author’s calculations.