

Post-benchmark revision, here are changes in the BLS and ADP series:
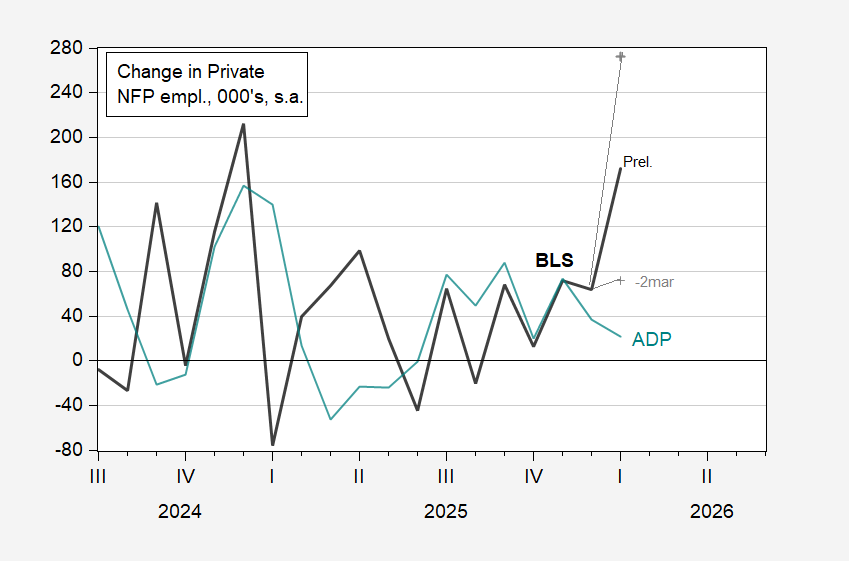
Figure 1: Change in BLS private nonfarm payroll employment (bold black), +/- 2 mean absolute revision (gray +), and change in ADP private nonfarm payroll employment (teal), both in 000’s, s.a. MAR is at 50K, using total NFP for 2023-24 figures. Source: BLS and ADP via FRED, BLS, and author’s calculations.
The mean absolute revision for total nonfarm payroll employment going from first release to third release in 2023-24 is about 50,000. Using this figure, I can put an approximately 95% band on changes. The BLS series looks substantially higher than the corresponding ADP series (the standard deviation of the difference between changes in the two series is about 90K, mean error about zero).
In terms of cumulative change (in percent) since 2025M01, this is the picture.
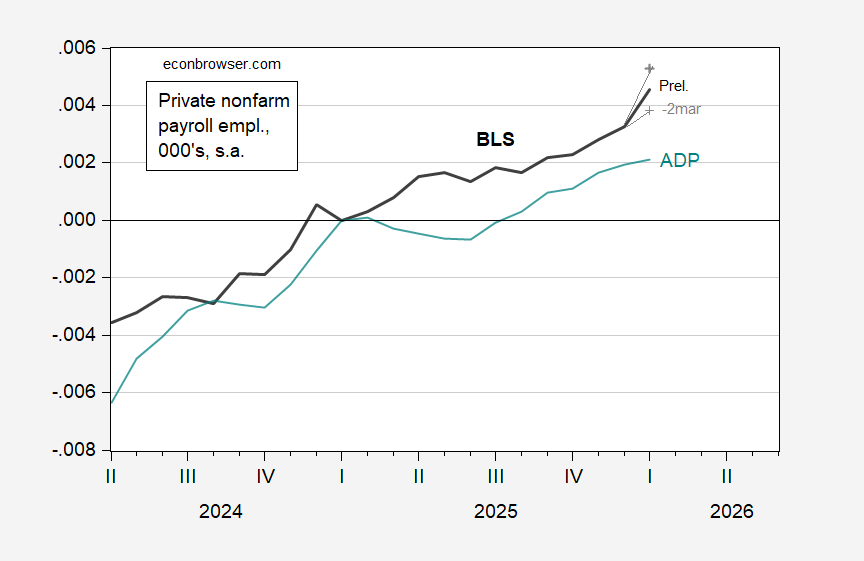
Figure 2: Cumulative change in BLS private nonfarm payroll employment (bold black), +/- 2 mean absolute revision (gray +), and change in ADP private nonfarm payroll employment (teal), all in logs, 2025M01=0, s.a. MAR is at 50K, using total NFP for 2023-24 figures. Source: BLS and ADP via FRED, BLS, and author’s calculations.