

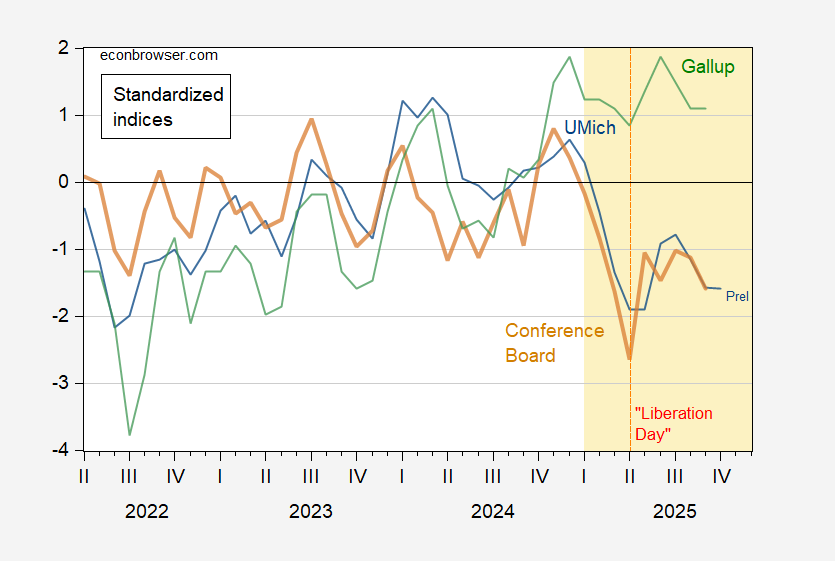
With today’s release of University of Michigan Survey of Consumers (preliminary) data, we have this picture.

Figure 1: U.Michigan Economic Sentiment (blue), Conference Board Confidence Index (brown), Gallup Confidence (green), all demeaned and divided by standard deviation 2021M01-2025m02. Red dashed line at “Liberation Day” Source: UMichigan, Gallup, Conference Board, and author’s calculations.
The above graph is normalized on 2021M01-2025M02 period mean and standard deviations. Over a longer horizon, we have the following picture of the (unstandardized) Michigan Sentiment index.
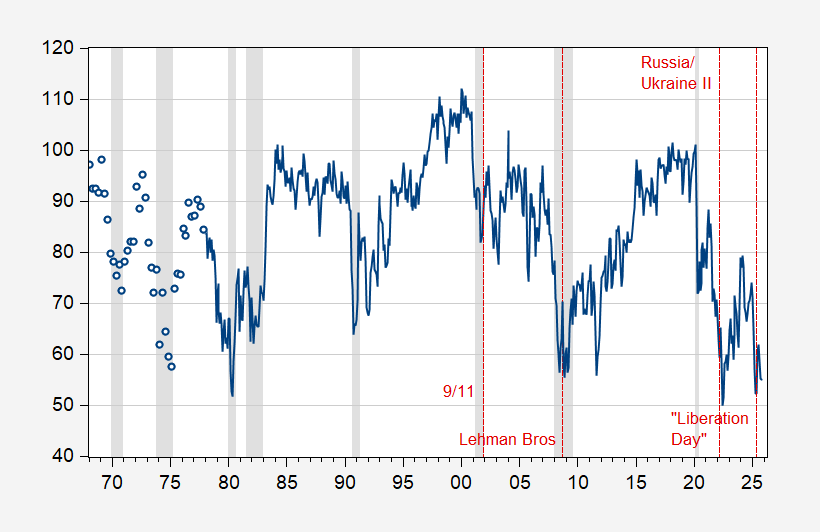
Figure 2: U.Michigan Economic Sentiment (blue). October value is preliminary. Red dashed line at selected critical events. NBER defined peak-to-trough recession dates shaded gray. Source: UMichigan, and NBER.
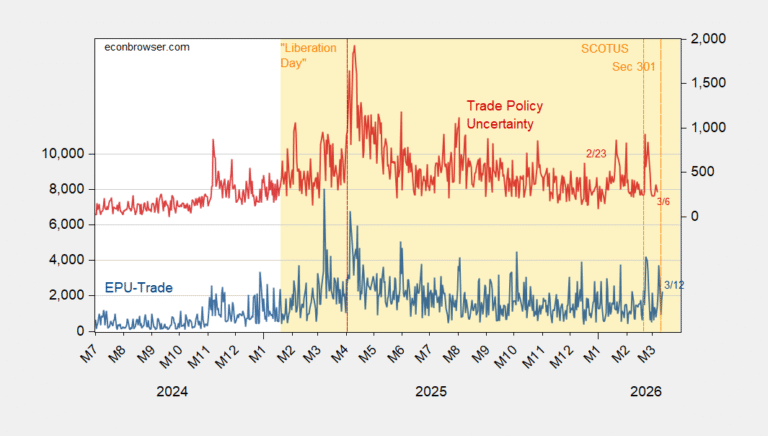
I can hardly wait to see how sentiment evolves as Trump re-ignites the trade war along the China dimension. We should see something EPU-wise sooner.